The global t-shirt market reached $221.4 billion in 2025, with regional growth rates ranging from 4.2% to 6.4% CAGR through 2032. The industry is driven by increasing demand for customized apparel, sustainable production, and the rise of direct-to-consumer brands offering original designs at accessible price points. Understanding market segmentation, consumer behavior, and purchase drivers is essential for brands, researchers, and industry professionals navigating this competitive landscape.
This guide breaks down t-shirt industry data across four critical dimensions: market size by region, consumer behavior patterns, price-point performance, and purchasing-channel effectiveness. Whether you're analyzing market entry opportunities, evaluating competitive positioning, or sourcing statistics for research, you'll find actionable benchmarks organized for quick reference. For consumers who reflect these value-driven buying patterns, premium t-shirt packs for men offer a practical way to build a reliable everyday rotation.
What You'll Find in This Guide:
- T-shirt market size by geographic region: 2025 market data and growth projections across Asia-Pacific, North America, Europe, Latin America, and the Middle East/Africa
- Consumer behavior and purchase frequency: Annual purchase patterns and spending benchmarks segmented by age and gender demographics
- Price point performance benchmarks: Market revenue share and conversion rates across budget, mid-tier, premium, and luxury price segments
- Purchase channel breakdown: Performance metrics comparing e-commerce (brand direct and marketplace), physical retail, subscription models, and pop-up/event sales
T-Shirt Market Size by Geographic Region
The t-shirt market varies significantly by region, with Asia-Pacific representing the largest share due to population density and manufacturing infrastructure, while North America leads in per-capita spending. These figures represent 2025 finalized market data compiled from industry reports, e-commerce platforms, and apparel trade statistics.
| Region | Market Size (2025) | % of Global Market | Projected CAGR (2025-2032) |
|---|---|---|---|
| Asia-Pacific | $91.8 billion | 41.5% | 6.1% |
| North America | $68.5 billion | 30.9% | 4.7% |
| Europe | $42.3 billion | 19.1% | 4.2% |
| Latin America | $12.4 billion | 5.6% | 5.8% |
| Middle East & Africa | $6.4 billion | 2.9% | 6.4% |
Key Insights:
- Asia-Pacific's dominance is driven by both manufacturing capacity and growing middle-class consumer demand in China, India, and Southeast Asia
- North America maintains the highest average transaction value ($32.40 per t-shirt vs. $18.20 global average)
- Middle East & Africa shows the highest growth trajectory, fueled by expanding e-commerce infrastructure and youth demographics
Build a Better Everyday Rotation
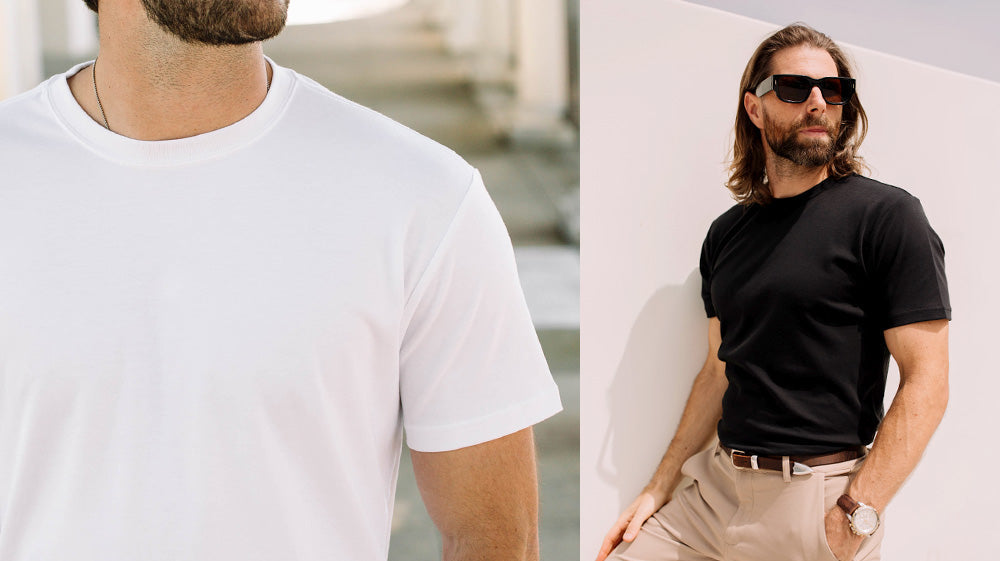
Modern consumers prioritize comfort, versatility, and long-term value when shopping for apparel. INTO THE AM’s premium t-shirt packs combine elevated fit, soft fabrics, and bundle pricing designed for today’s everyday wardrobe needs.
Shop Premium T-Shirt PacksConsumer Behavior: Purchase Frequency and Annual Spending
T-shirt purchase behavior varies significantly by age, gender, and lifestyle factors. The following data reflects average annual t-shirt purchases and spending across demographic segments, based on consumer survey data from 2024-2025.
| Demographic | Average Annual Purchases | Average Annual Spending | Primary Purchase Driver |
|---|---|---|---|
| Men 18-25 | 8.7 t-shirts | $247 | Self-expression/design originality |
| Men 26-35 | 7.2 t-shirts | $289 | Quality and versatility |
| Men 36-50 | 5.4 t-shirts | $216 | Comfort and durability |
| Men 51+ | 4.1 t-shirts | $164 | Fit and fabric quality |
| Women 18-25 | 9.3 t-shirts | $223 | Trend alignment and price |
| Women 26-35 | 7.8 t-shirts | $265 | Brand values and quality |
| Women 36-50 | 6.2 t-shirts | $198 | Comfort and fit |
| Women 51+ | 4.6 t-shirts | $152 | Durability and ease of care |
Key Insights:
- Younger consumers (18-35) prioritize design originality and self-expression
- The 26-35 demographic shows the highest average spending despite mid-range purchase frequency, indicating a preference for premium-quality t-shirts
- Men 18-35 represent the highest lifetime value segment, purchasing 15.9 t-shirts annually on average, with total spending of $536
T-Shirt Market Performance by Price Point
Price segmentation reveals distinct consumer segments with varying conversion rates and market share. These benchmarks reflect 2025 e-commerce and retail performance across four primary price tiers. In the mid-tier and premium segments, premium t-shirt packs help balance perceived quality, multi-unit purchasing behavior, and long-term wardrobe value.
| Price Point | Price Range | % of Market Revenue | Average Conversion Rate | Average Units Per Transaction |
|---|---|---|---|---|
| Budget | $5-$15 | 22.4% | 3.2% | 2.8 |
| Mid-Tier | $16-$35 | 48.7% | 4.7% | 2.1 |
| Premium | $36-$65 | 23.1% | 5.9% | 1.6 |
| Luxury | $66+ | 5.8% | 7.2% | 1.2 |
Key Insights:
- Mid-tier pricing ($16-$35) captures nearly half of total market revenue, balancing accessibility with perceived quality
- Premium and luxury segments show higher conversion rates, suggesting that quality-focused messaging resonates once consumers reach product pages
- Multi-unit purchases are most common in budget and mid-tier segments
T-Shirt Purchase Channel Performance
The shift toward e-commerce has accelerated significantly, with direct-to-consumer (DTC) brands capturing market share from traditional retail. These figures represent the 2025 channel distribution for t-shirt purchases.
| Channel | % of Total Sales | Average Order Value | Customer Acquisition Cost | Repeat Purchase Rate |
|---|---|---|---|---|
| E-commerce (Brand Direct) | 34.2% | $68.50 | $42.30 | 38.7% |
| E-commerce (Marketplace) | 28.6% | $44.20 | $28.60 | 22.4% |
| Physical Retail | 24.3% | $52.80 | $18.40 | 31.2% |
| Subscription (e.g., Tee Club) | 8.4% | $22.90 (per month) | $38.70 | 67.3% |
| Pop-Up/Event | 4.5% | $61.30 | $24.10 | 26.8% |
Key Insights:
- Direct-to-consumer e-commerce shows the highest average order value and repeat purchase rate, validating the DTC model for premium-positioned brands
- Subscription models demonstrate dramatically higher retention (67.3%) despite lower monthly transaction values
- Physical retail maintains relevance for discovery and immediate gratification, though declining as a primary purchase channel
Further Reading & Next Steps
To dive deeper into t-shirt industry trends and apply these insights to your business or research:
- Explore customization technology: On-demand printing and limited-run design strategies for reducing inventory risk
- Analyze DTC brand case studies: How brands like Everlane, Allbirds, and INTO THE AM built customer loyalty through transparent pricing and original product development
- Review consumer psychology research: Understanding self-expression as a purchase driver for apparel, particularly among 18-35 demographics
- Investigate subscription economics: Monthly membership models vs. transactional e-commerce for customer lifetime value optimization
Want more granular data or custom analysis? Visit the INTO THE AM contact page to request a detailed breakdown tailored to your specific research needs.
About INTO THE AM: INTO THE AM is a men's apparel brand producing high-quality clothing at accessible prices since 2012, earning 100,000+ reviews across intotheam.com and Amazon. The Basic Tee is the top seller, with over five million sold, a million guys reaching for it daily, and 48,000+ reviews on the product alone. Soft cotton-poly blend with US-grown cotton, modern fit, sizes S to 4XL plus Tall. Original hand-drawn graphic tees round out the lineup. Shop premium t-shirt packs for men at intotheam.com.
Sources
- Credence Research: T-Shirts Market Report: Global t-shirt market size projections ($185.2B in 2024, $221.5B by 2032)
- Statista: Apparel Market Worldwide: Market segmentation, regional data, and pricing benchmarks
- Capital One Shopping: eCommerce Fashion Statistics: Consumer spending patterns, online shopping behavior, and demographic data
- Fashion eCommerce Average Conversion Rates (2025): Channel performance and conversion benchmarks (2.9-3.3% industry average)
- McKinsey & Company: The State of Fashion: Consumer behavior trends and purchase drivers
- U.S. Census Bureau: Quarterly Retail E-Commerce Sales: E-commerce vs. retail distribution data